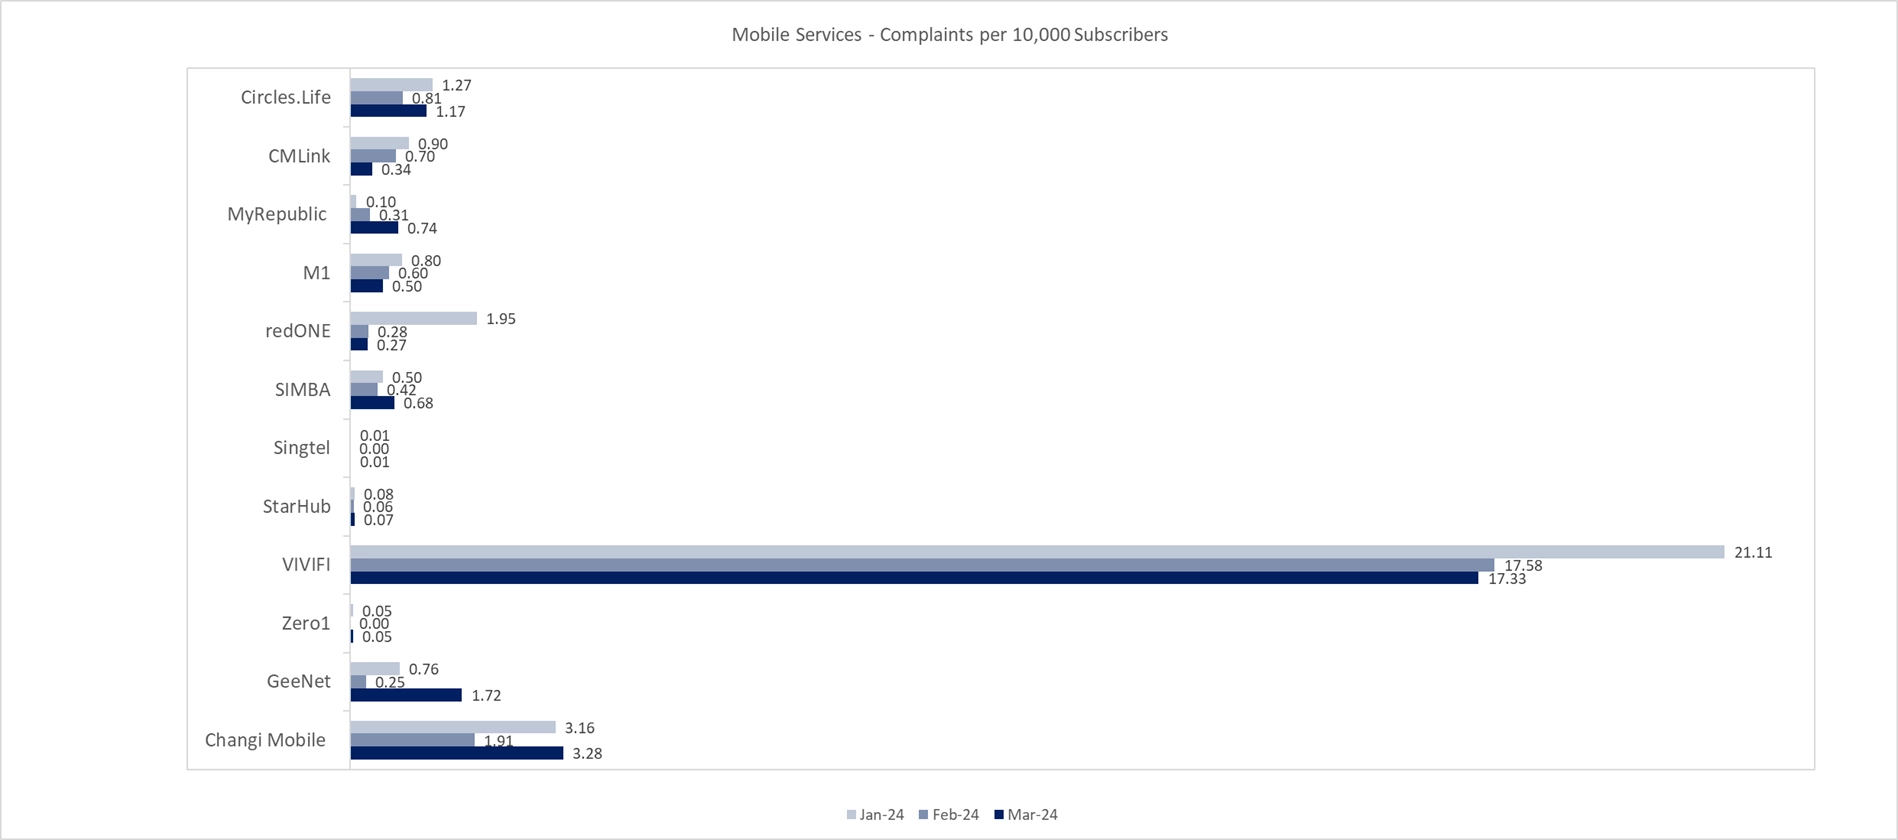
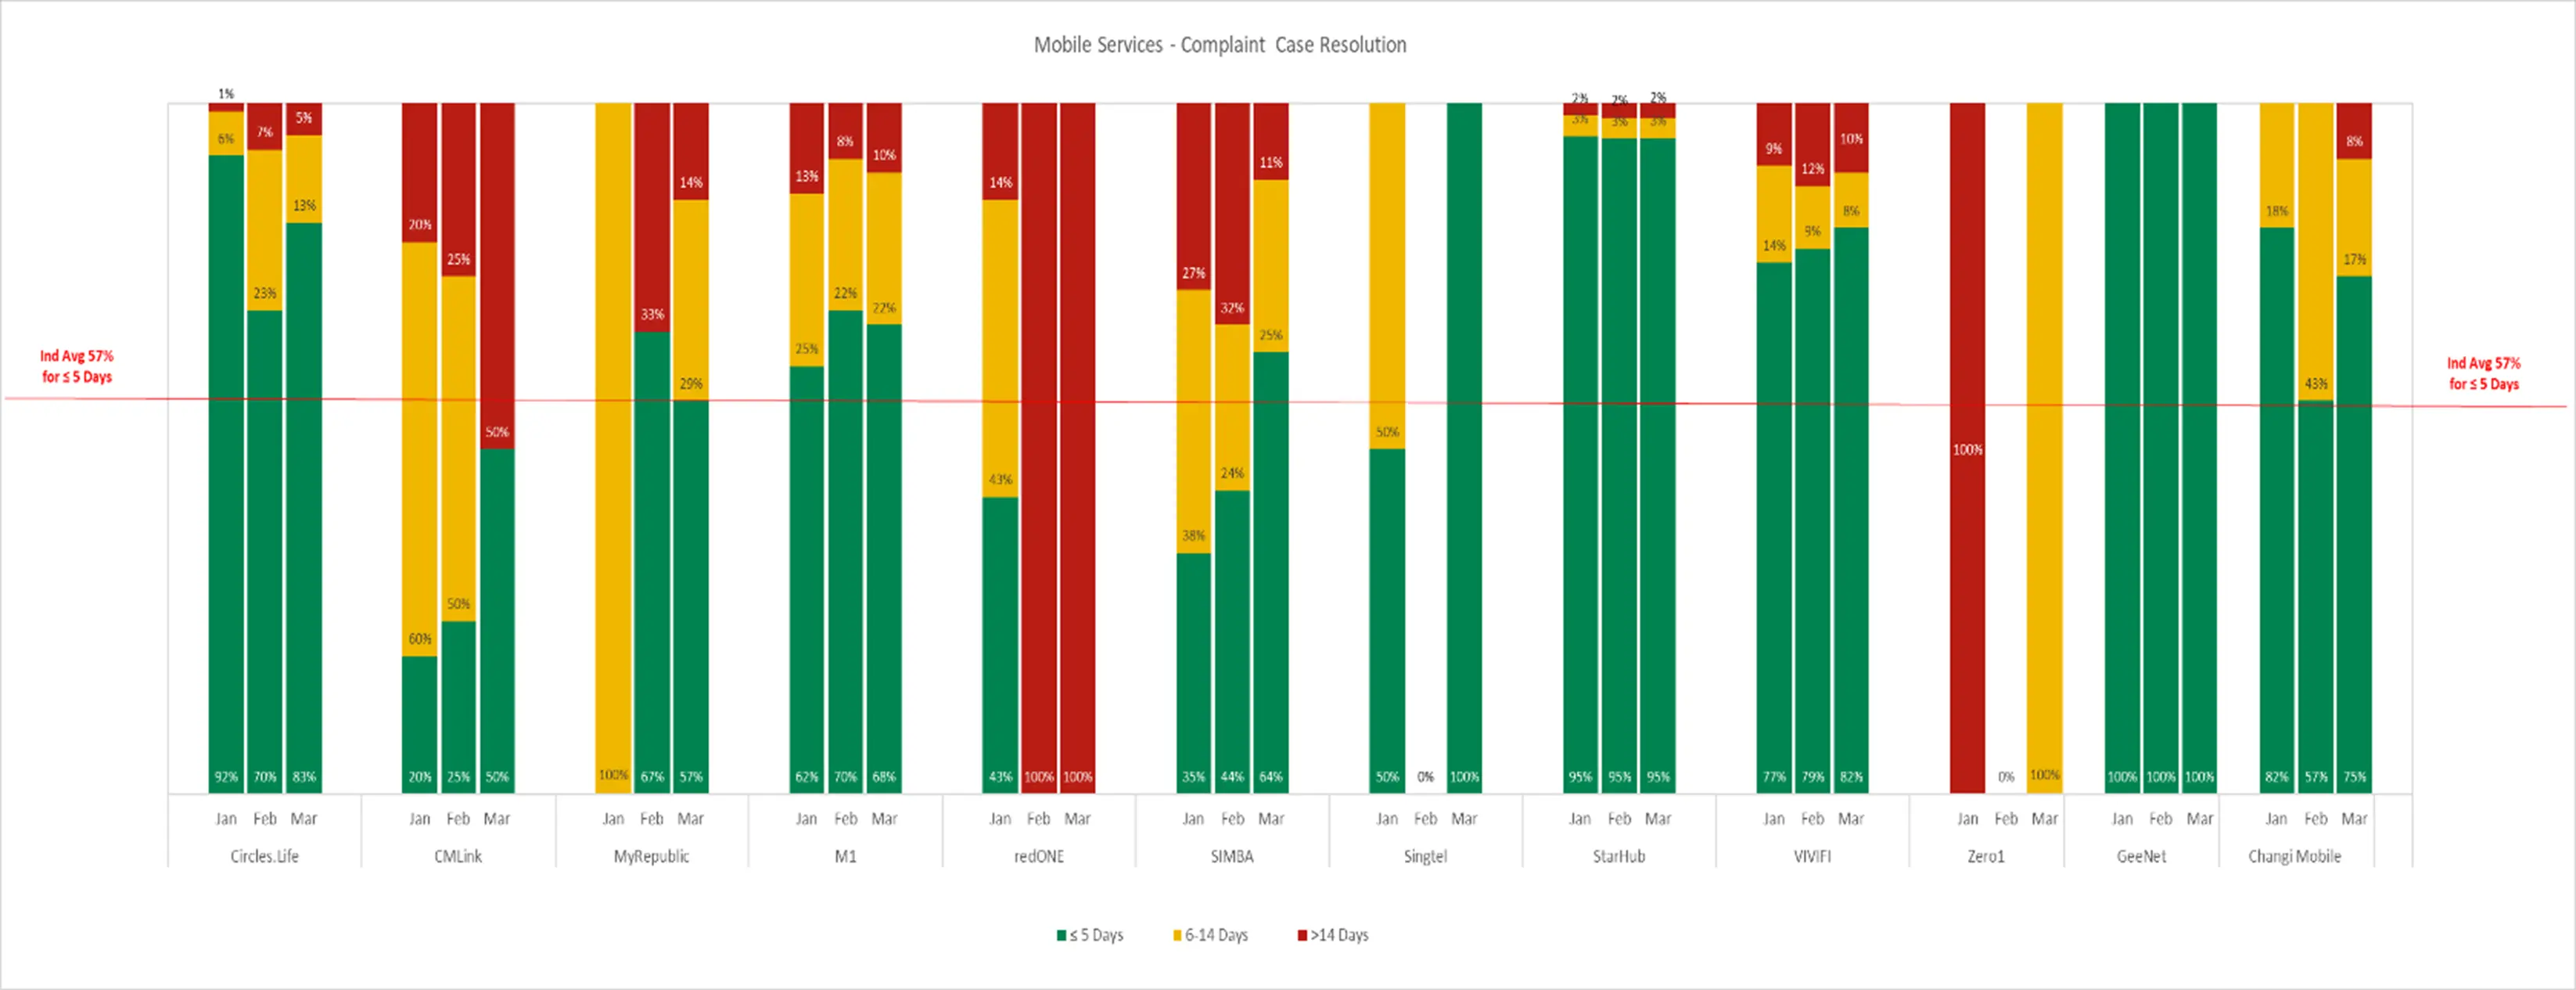
Mobile Services
i) Number of complaints1 per 10,000 subscribers
ii) Percentage of resolved complaints
iii) Average hotline5 / live chat waiting time (mins)2
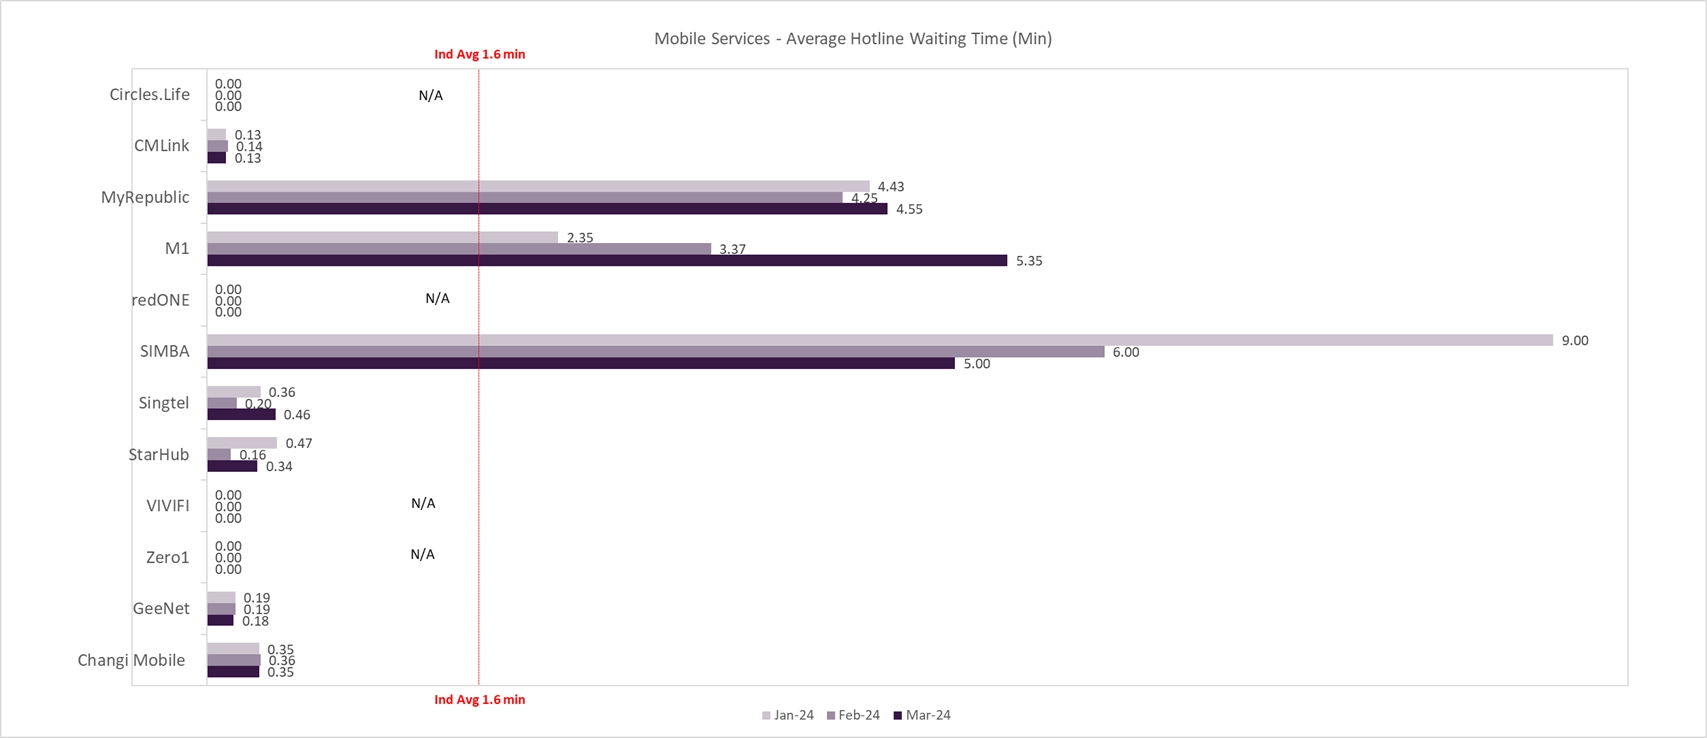
Legend:
- “N/A” indicates that the telecom service provider does not offer hotline or live chat for consumers to provide feedback.
- Figures are rounded off to 2 decimal places, except those in percentages. For example, a result of 0.00 complaint per 10,000 subscribers does not necessarily reflect no complaint for a particular service in that month.
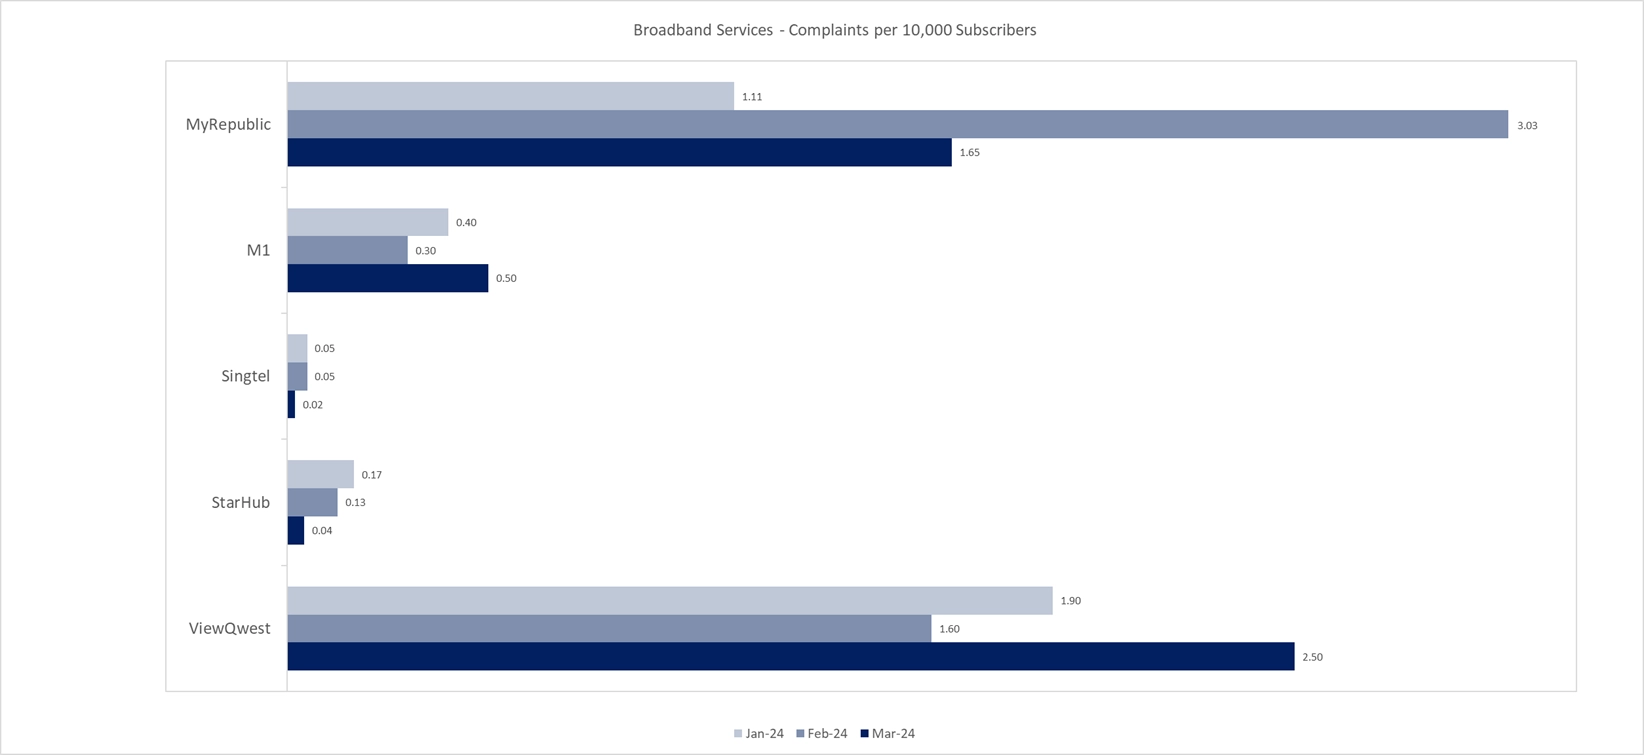
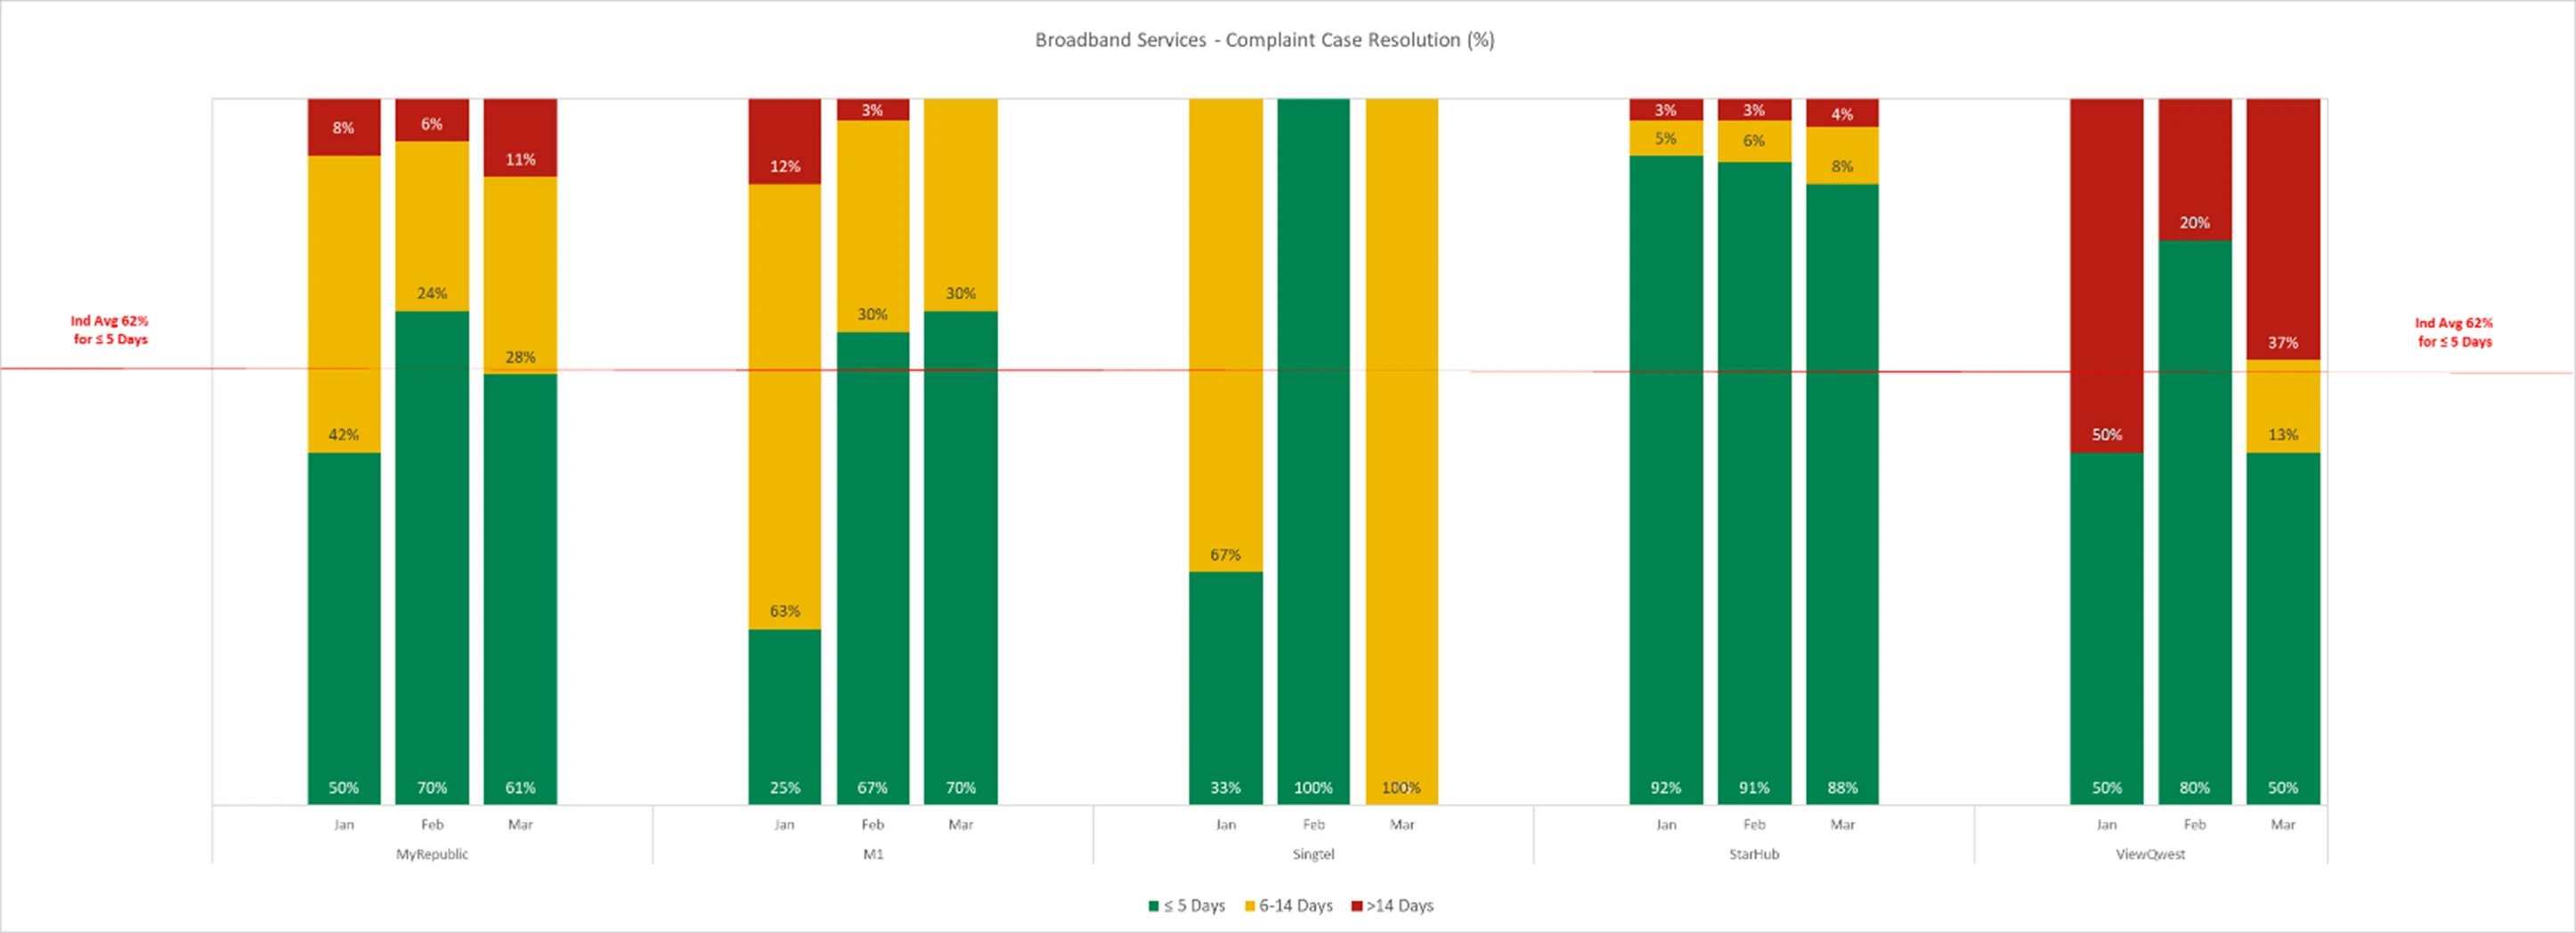
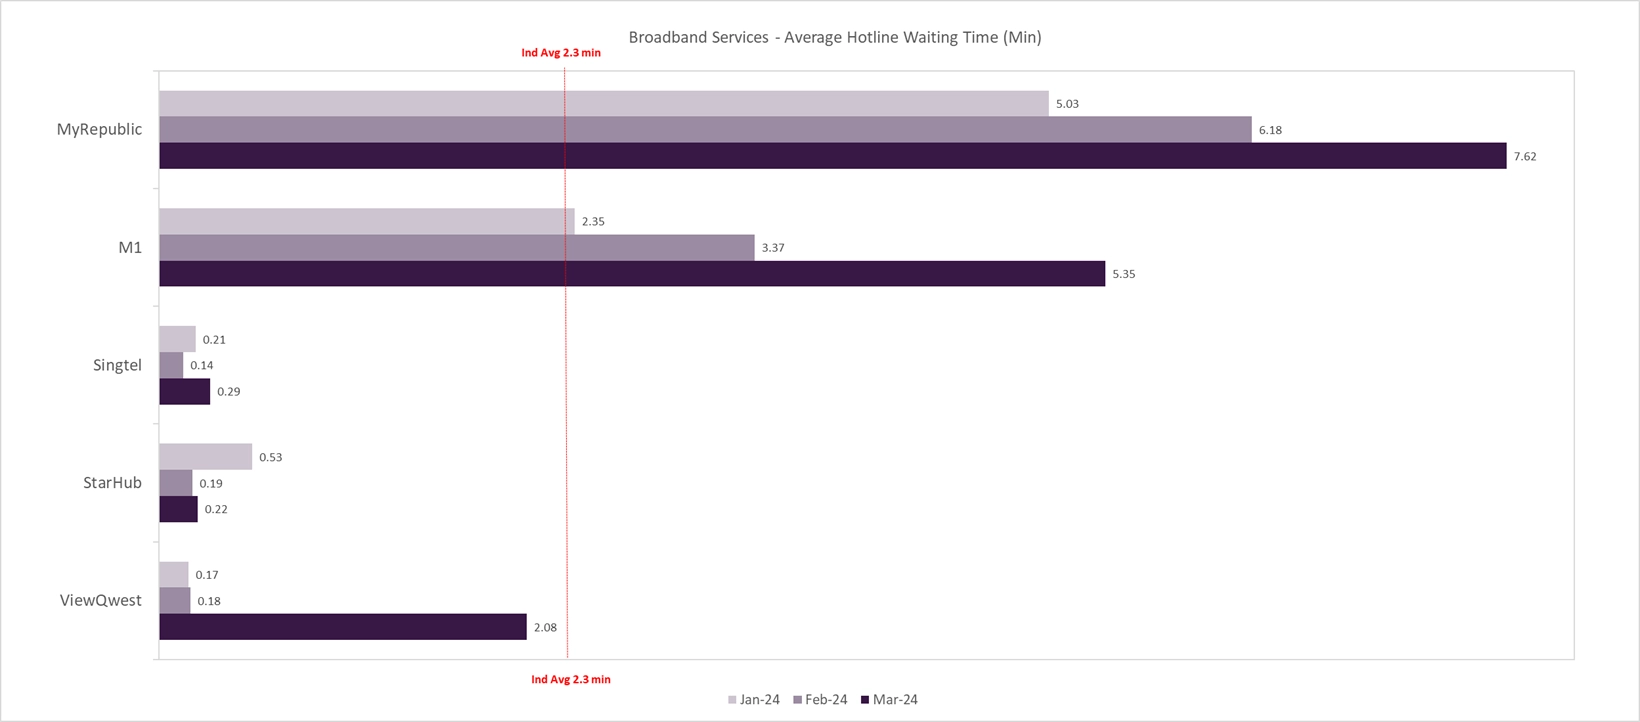
Broadband Services
i) Number of complaints1 per 10,000 subscribers
ii) Percentage of resolved complaints
iii) Average hotline5 / live chat waiting time (mins)2
Legend:
- “N/A” indicates that the telecom service provider does not offer hotline or live chat for consumers to provide feedback.
- Figures are rounded off to 2 decimal places, except those in percentages. For example, a result of 0.00 complaint per 10,000 subscribers does not necessarily reflect no complaint for a particular service in that month.
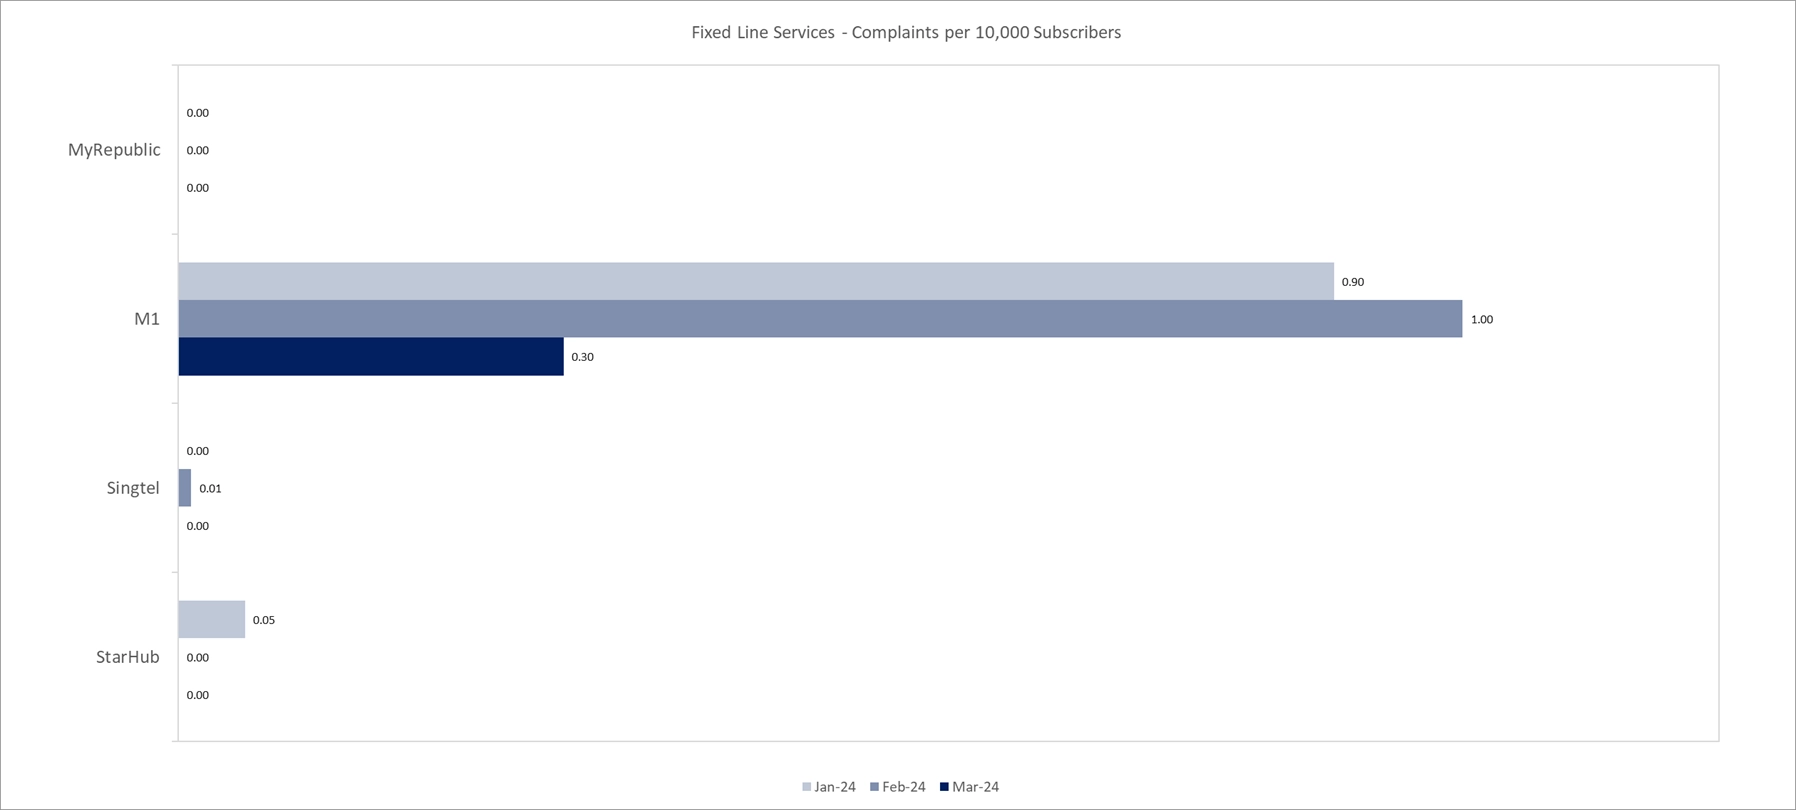
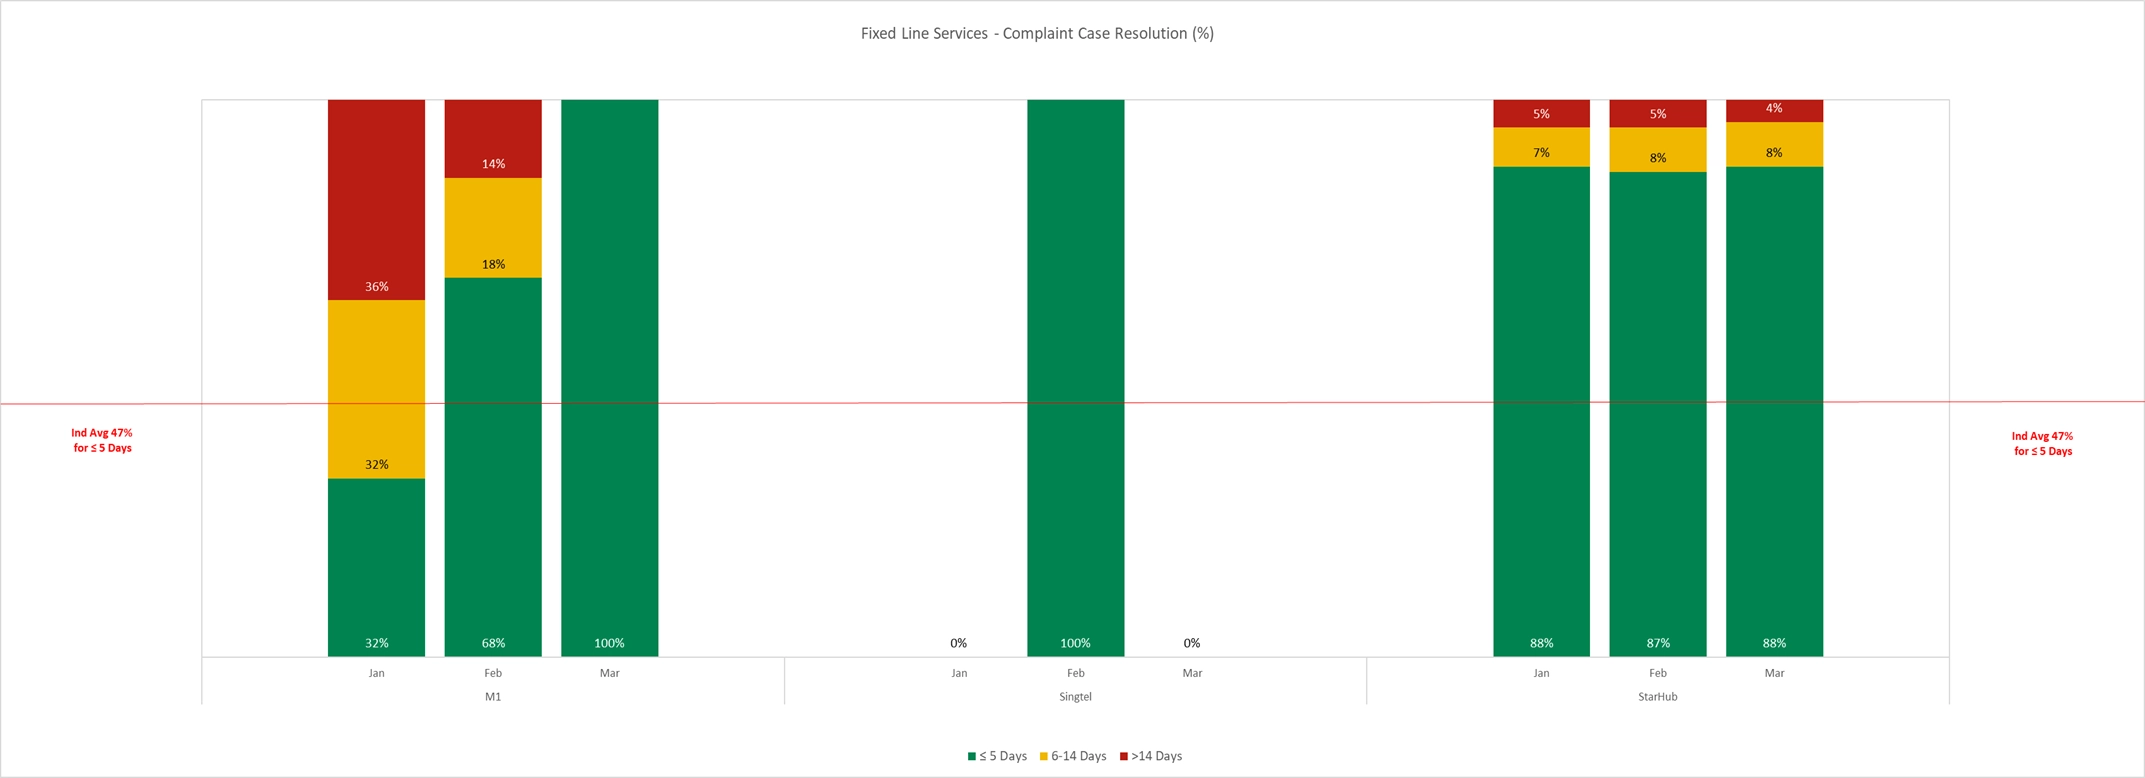
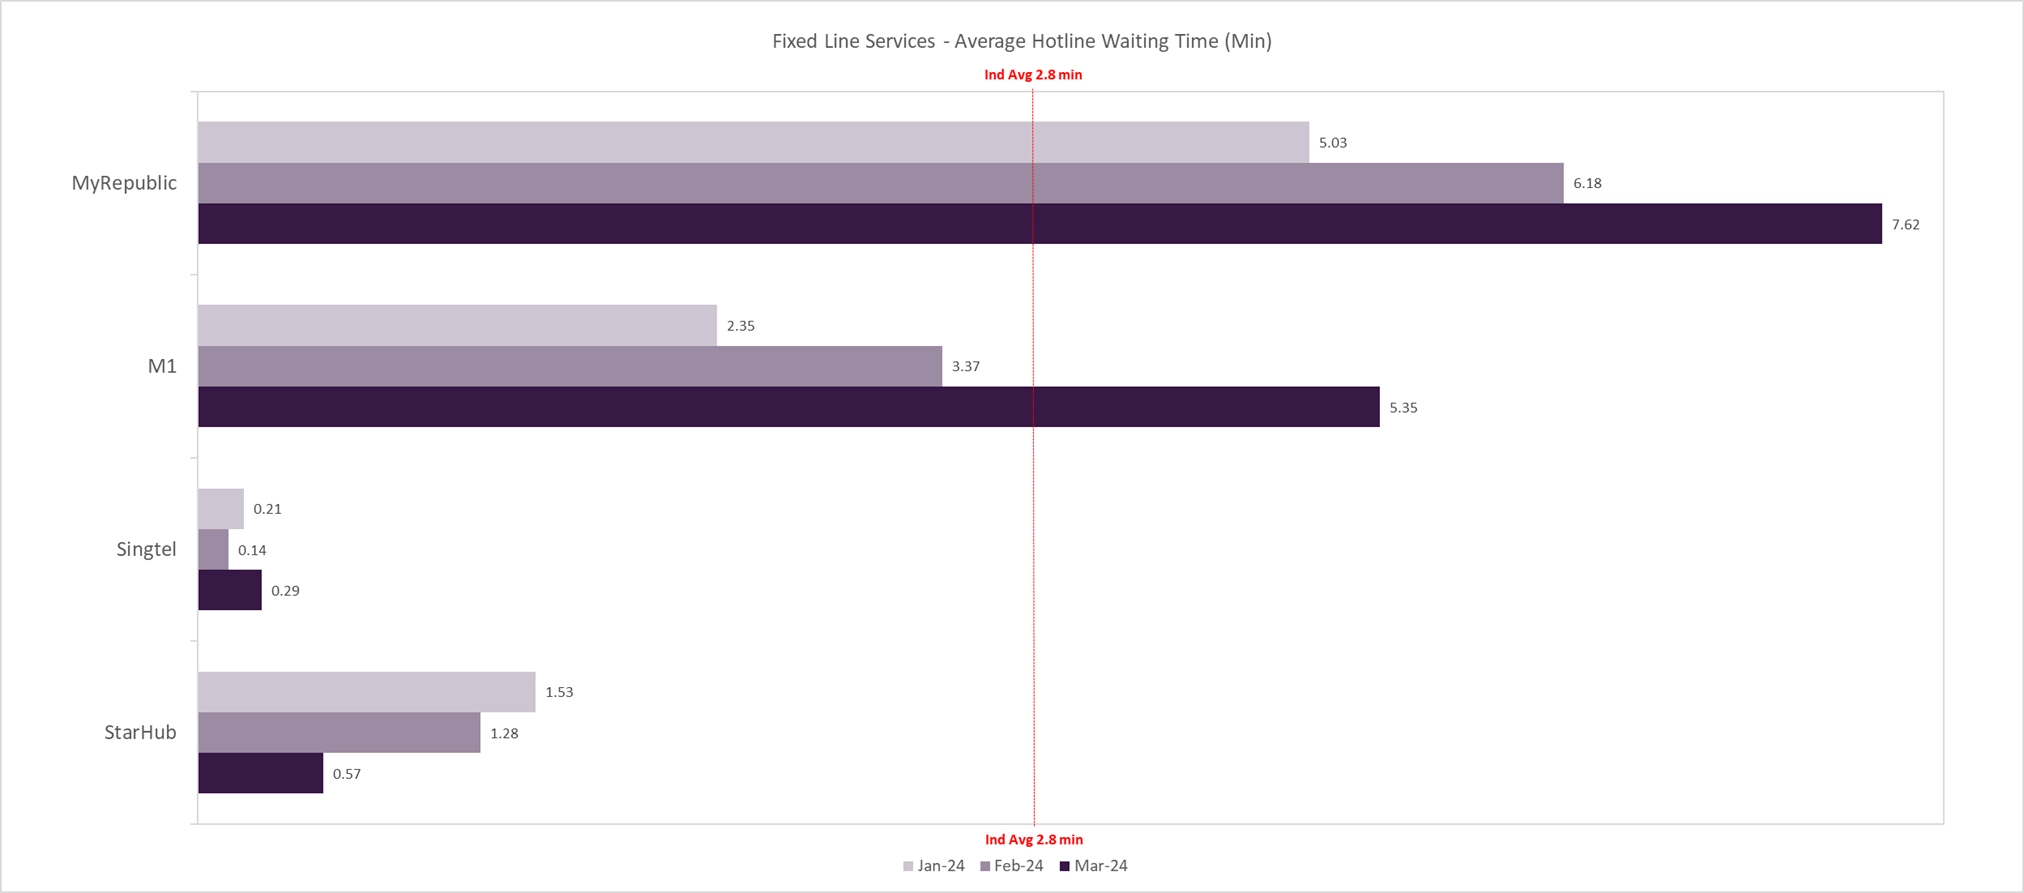
Fixed Line Services3
i) Number of complaints1 per 10,000 subscribers
ii) Percentage of resolved complaints
iii) Average hotline5 / live chat waiting time (mins)2
Legend:
- “N/A” indicates that the telecom service provider does not offer hotline or live chat for consumers to provide feedback.
- Figures are rounded off to 2 decimal places, except those in percentages. For example, a result of 0.00 complaint per 10,000 subscribers does not necessarily reflect no complaint for a particular service in that month.
Footnotes
1 For the purpose of this report, the term “complaint” is defined as any expression of dissatisfaction with a telecom service that requires follow up by the service provider.
2 This measures the time between the moment a consumer chooses to speak to a customer service officer and the moment the officer responds. Where both hotline and live chat are offered by a telecom service provider, the average waiting time for hotline would be reflected.
3 Fixed line services include standalone fixed line services and digital voice services provided together with broadband subscription.
4 For the avoidance of doubt, the actual figure is not zero. It is a figure which only shows up at or after the third decimal point.
5 SIMBA’s helpline provides for SIMBA’s Seniors’ Plan customers only and is not a general customer service line.
.webp)